ELK setup guide
本文共 12731 字,大约阅读时间需要 42 分钟。
注意:ELK前置需要JDK7(update 55)以后版本。 <elasticsearch> 基于Lucene的分布式多用户能力的全文搜索引擎,用Java开发,基于RESTful web接口。 # 概念 index pattern data set has an index, each set of data loaded to Elasticsearch has an index pattern, An index pattern is a string with optional wildcards that can match multiple indices. e.g. logstash-2015.05* Index 相当于OS中的folder Type 相当于OS中的Sub-folder Document 相当于OS中的Excel File Field 相当于OS中的Excel中的field Shard、Replication 默认情况下,Elasticsearch中的每个索引被分片5个主分片和1个复制 # 下载 https://www.elastic.co/downloads http://mobz.github.io/elasticsearch-head/ # 解压 tar -zvxf elasticsearch-1.1.0.tar.gz -C /appl cd /appl/elasticsearch-2.1.1 # 配置, https://www.elastic.co/guide/en/elasticsearch/guide/current/heap-sizing.html vi /etc/profile export ES_HEAP_SIZE=1g source /etc/profile # don't run elasticsearch as root groupadd elasticsearch useradd -d /home/elasticsearch -m elasticsearch -g elasticsearch -p elasticsearch chown -R elasticsearch:elasticsearch elasticsearch-2.1.1 # 启动 as daemon su - elasticsearch cd /appl/elasticsearch-2.1.1/ bin/elasticsearch -d -p pid (初始调试时使用:bin/elasticsearch) # 关闭 kill `cat pid` # 查看 ps -ef|grep search # 以下WARN可以不用理会 unable to install syscall filter: prctl(PR_GET_NO_NEW_PRIVS): Invalid argument curl命令参考: # 查看lucene版本 curl 'localhost:9200/' # 查看总体index curl 'localhost:9200/_cat/indices?v' # 查看plugin ./bin/plugin --list # 批量插入数据 curl -XPOST 'localhost:9200/shakespeare/_bulk?pretty' --data-binary @shakespeare.json # 插入数据 curl -XPUT 'http://localhost:9200/dept/employee/1' -d '{ "empname": "emp1"}' curl -XPUT http://localhost:9200/shakespeare -d ' { "mappings" : { "_default_" : { "properties" : { "speaker" : {"type": "string", "index" : "not_analyzed" }, "speech_number" : { "type" : "integer" } } } } } '; # 查看 curl 'localhost:9200/dept/' curl 'localhost:9200/shakespeare/' curl "http://localhost:9200/dept/employee/_search?pretty" curl 'localhost:9200/_search?pretty' curl 'localhost:9200/logstash-2016.02.08/indx/1?pretty' #删除 curl -XDELETE 'http://172.16.1.16:9200/logstash-2016.02.*' # 开启remote端口给主机访问 /sbin/iptables -I INPUT -p tcp --dport 9200 -j ACCEPT /etc/init.d/iptables save service iptables restart #ES-head插件安装 安装方法:http://mobz.github.io/elasticsearch-head/ 效果图:http://www.tuicool.com/articles/eeauam #smartcn, ES默认的中文分词 https://github.com/elasticsearch/elasticsearch-analysis-smartcn #pinyin, 拼音分词,可用于输入拼音提示中文 https://github.com/medcl/elasticsearch-analysis-pinyin #elasticsearch-rtf,针对中文集成了相关插件(rtf = Ready To Fly) https://github.com/medcl/elasticsearch-rtf # 参考 https://www.elastic.co/guide/en/elasticsearch/reference/current/setup.html http://www.tuicool.com/articles/eeauam http://blog.csdn.net/cnbird2008/article/details/38762795 http://stackoverflow.com/questions/23520684/elasticsearch-java-apinonodeavailableexception-no-node-available http://blog.csdn.net/cnweike/article/details/39083089 <elasticsearch-集群> 说明:Es的集群非常简单,只要在同一个局域网内,多台服务器能互相通讯,并且cluster.name是一样的,就能自动集在一起。curl 'localhost:9200/_cluster/health/'
<elasticsearch-使用hostname代替localhost> curl '<hostname>:9200/_cluster/health/' node1 - elasticsearch.ymlcluster.name: es-clusternode.name: es-node-1node.master: truenode.data: truenetwork.host: centos1transport.tcp.port: 9300http.port: 9200
node2 - elasticsearch.yml
cluster.name: es-clusternode.name: es-node-2node.master: falsenode.data: truenetwork.host: centos2transport.tcp.port: 9300http.port: 9200端口 9300:node-to-node communication 9200:HTTP traffic lsof -i:9200 lsof -i:9300 <logstash> 对日志数据语法分析。由JRuby开发 ,基于消息(message-based)的简单架构,并运行在Java虚拟机(JVM)上。 # 下载 https://www.elastic.co/downloads # 解压 tar -zvxf logstash-2.1.1.tar.gz -C /appl cd /appl/logstash-2.1.1 # 测试 cd logstash-{logstash_version} bin/logstash -e 'input { stdin { } } output { stdout {} }' 输入hello CTRL-D退出 # 测试配置 配置语法参考: Pattern语法参考: (1)vi /appl/logstash-2.1.1/test.conf
input{ file { path => "/mk/test/elasticsearch.log.2016-02-06_02" start_position => beginning type => "eslogs" codec => multiline { pattern => "^\s" what => "previous" } }}filter { if [type] == "eslogs" { grok { patterns_dir => ["/appl/logstash-2.1.1/patterns"] match => { "message" => "%{ES_LOG}"} } }}output{ elasticsearch {} stdout {codec => rubydebug} file { path => "/appl/logstash-2.1.1/logs/test.log" }} (2)vi /appl/logstash-2.1.1/patterns/pattern_sys_es 
# 启动
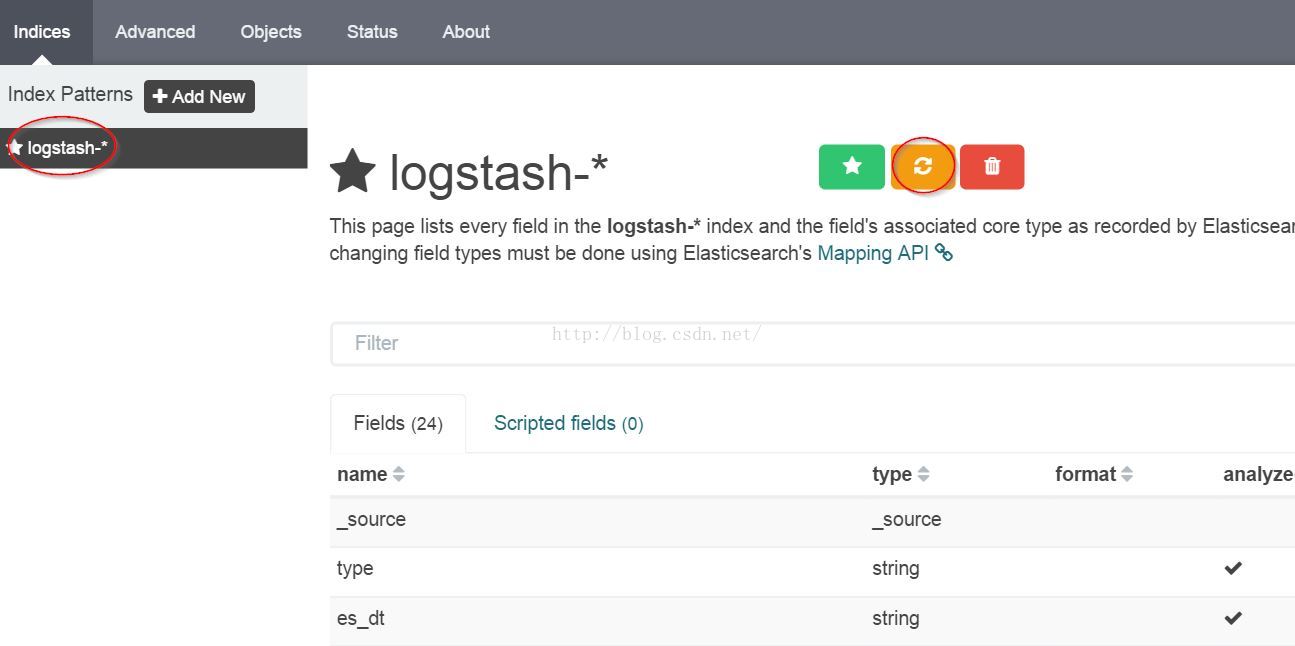
bin/logstash -f /appl/logstash-2.1.1/test.conf --configtest (先测试配置语法) bin/logstash -f /appl/logstash-2.1.1/test.conf # 参考 https://www.elastic.co/guide/en/logstash/current/getting-started-with-logstash.html #端口默认9292 #内置的web 启动:java -jar /search/logstash/logstash-1.2.1-flatjar.jar web & 查看:http://127.0.0.1:9292 <kibana> 是一个基于浏览器页面的Elasticsearch前端展示工具。全部使用HTML语言和Javascript编写的。 # 下载 https://www.elastic.co/downloads # 解压 tar -zvxf kibana-4.3.1-linux-x64.tar.gz -C /appl mv kibana-4.3.1-linux-x64 kibana-4.3.1 cd /appl/kibana-4.3.1 # 配置 cd /appl/kibana-4.3.1/config cp kibana.yml kibana.yml.bak vi kibana.yml elasticsearch.url: "http://localhost:9200" # 开启remote端口给主机访问 /sbin/iptables -I INPUT -p tcp --dport 5601 -j ACCEPT /etc/init.d/iptables save service iptables restart # 启动 (Start Elasticsearch) cd /appl/kibana-4.3.1 bin/kibana (默认port 5601, 访问:http://localhost:5601/) # 验证(屏幕上直接输出日志)log [16:18:51.309] [info][status][plugin:table_vis] Status changed from uninitialized to green - Ready log [16:18:51.338] [info][listening] Server running at http://0.0.0.0:5601 log [16:18:56.460] [info][status][plugin:elasticsearch] Status changed from yellow to yellow - No existing Kibana index found log [16:19:00.183] [info][status][plugin:elasticsearch] Status changed from yellow to green - Kibana index ready#使用 (1)前提 curl 'localhost:9200/_cat/indices?v'能看到logstash的output。 (2)Settings 功能一级菜单包括:Discover、Visualize、Dashboard、Settings。初次使用首先进入Settings,二级菜单又分为:Indices、Advanced、Objects、Status、About。进入Indices。由于logstash在Elasticsearch中生成的索引一般以logstash-yyyy-mm-dd的形式存在,所以使用默认的logstash-*即可匹配到logstash中的output日志信息。注意,右上 方有个刷新按键,logstash中新定义的字段(如:上面test.conf中的%{DATE:es_dt}里的es_dt),要刷新才能在后面的Visualize、Dashboard中使用。如下图:
 (3)Discover 进入一级菜单中的Discover,如果看到提示说捕获不到信息,那看看最右上角,默认是15 mins,点击改长时间范围,如此应能捕获到elasticsearch的日志信息,如不能跳转(1)。左方有可选字段,如字段左边的图标是“?”跳转(2)。上方搜索栏有特定的query语法(见下面的“Query语法”)。右上角有保存搜索结果的图标,点击保存以用于后续的Visualize。 #Query语法 https://www.elastic.co/guide/en/elasticsearch/reference/current//query-dsl-query-string-query.html#query-string-syntax
 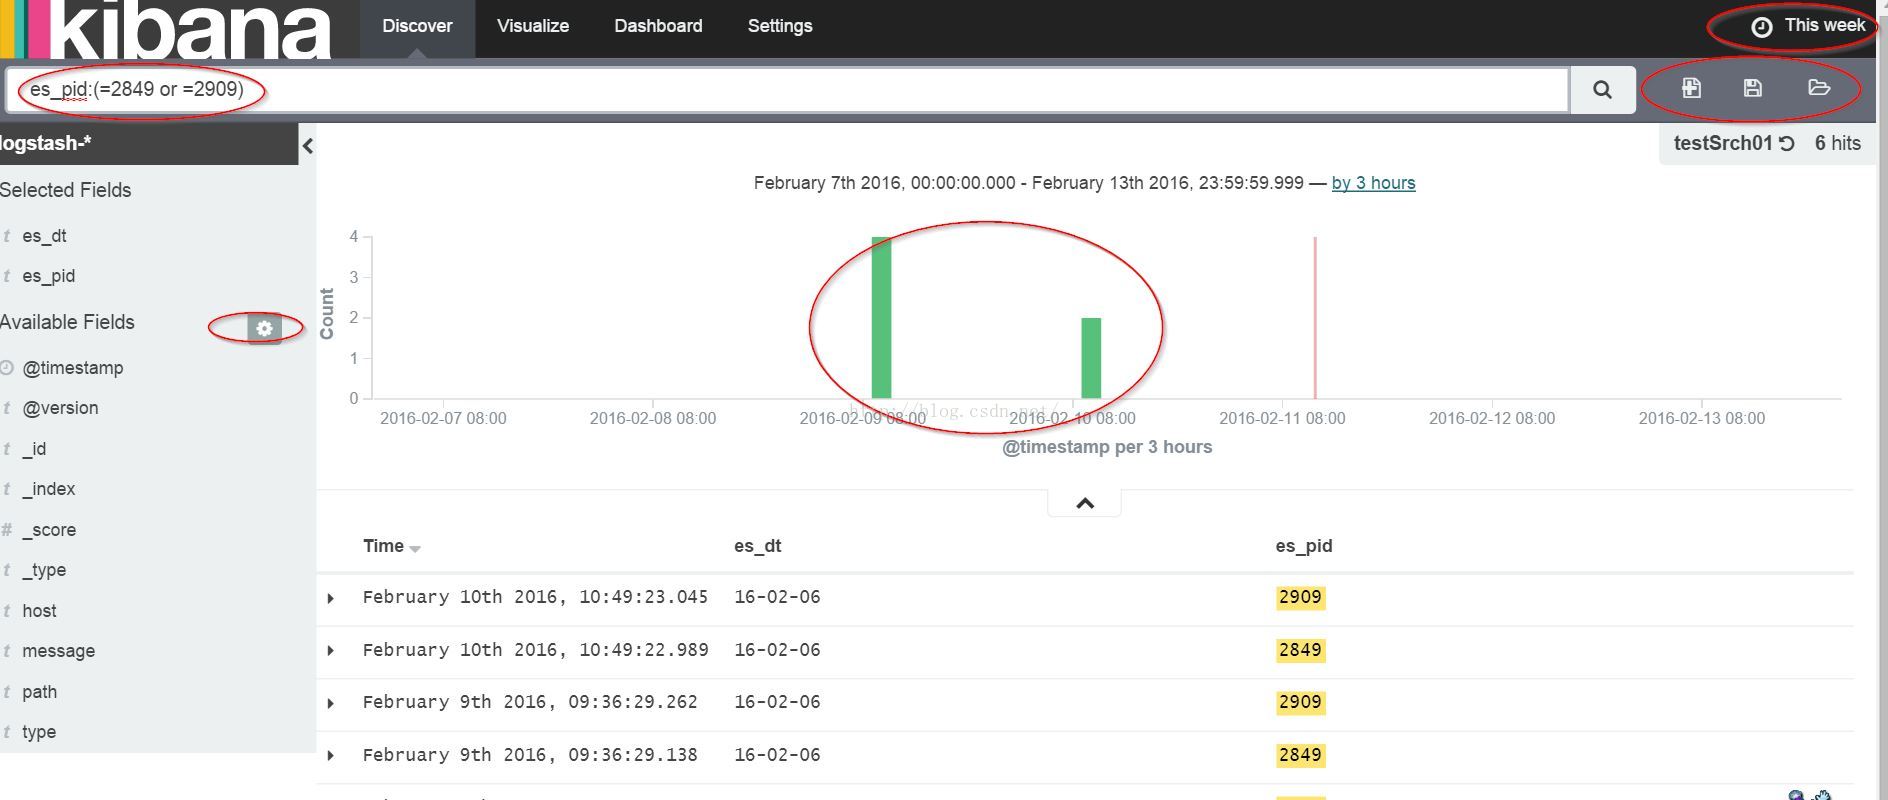 (4)Visualize 右上角点击load进刚才保存的搜索结果,metrics》Slice Size》Count,buckets》Split Charts》Aggregation:Terms》测试字段。图形显示正常则可保存结果(右上角按键)以用于后续Dashboard使用。如图:
 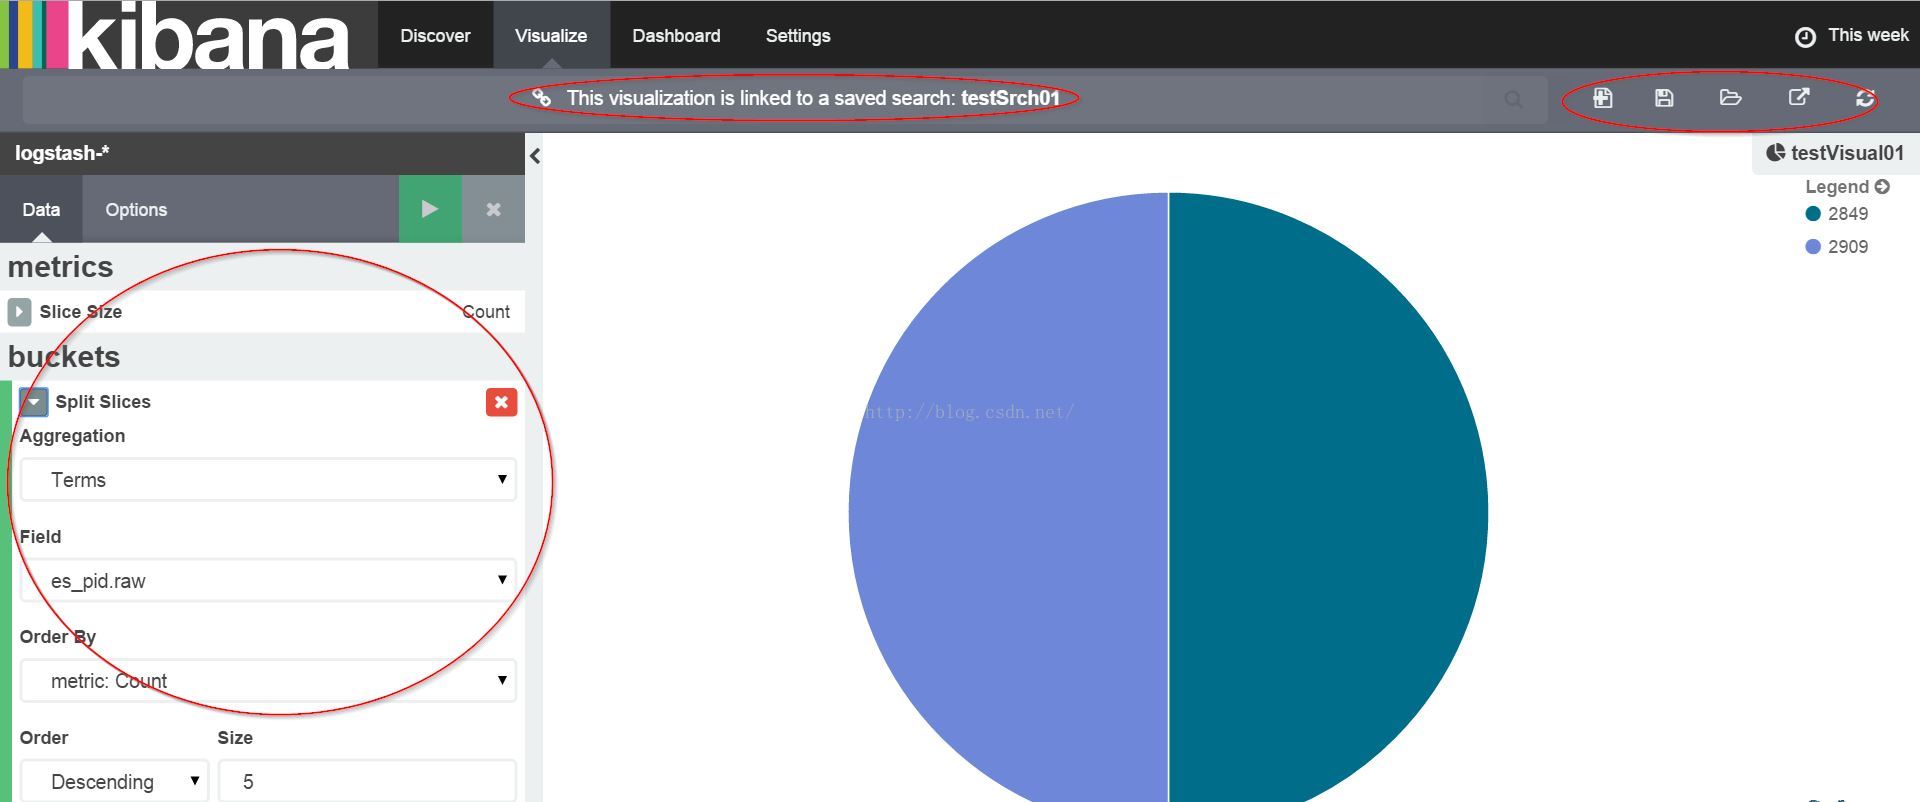 <Q&A> Q: Kibana》Discover》Can access Kibana, but message in homepage - Unable to fetch mapping; do you have indices matching the pattern A: (1)说明logstash没有把日志写入到elasticsearch;(2)Discover时间范围设大些 Q:Kibana》visualize》aggregation看不到logstash创建的字段 A:http://www.07net01.com/2015/12/1069635.html Q:与flume、hadoop等结合 A:http://zh.hortonworks.com/blog/configure-elastic-search-hadoop-hdp-2-0/ Q:Kibana可以与solr结合吗 A:https://lucidworks.com/products/silk/, https://github.com/LucidWorks/banana <每次启动命令> su - elasticsearch cd /appl/elasticsearch-2.1.1/ bin/elasticsearch -d -p pid cd /appl/logstash-2.1.1 bin/logstash -f /appl/logstash-2.1.1/test.conf cd /appl/kibana-4.3.1
 bin/kibana
<Plugin> 以集群健康监控插件marvel为例:1) elasticsearch命令
cd /2) Kibana命令/bin./plugin install license./plugin install marvel-agent
cd /(或直接下载:https://download.elastic.co/elasticsearch/marvel/marvel-2.2.0.tar.gz,copy到plugin目录即可) 3) start/bin./kibana plugin --install elasticsearch/marvel/2.2.0
cd /ES 日志/bin./elasticsearchcd / /bin./kibana
[elasticsearch@centos2 bin]$ ./elasticsearch[2016-04-29 16:21:11,964][WARN ][bootstrap ] unable to install syscall filter: seccomp unavailable: requires kernel 3.5+ with CONFIG_SECCOMP and CONFIG_SECCOMP_FILTER compiled in[2016-04-29 16:21:12,622][INFO ][node ] [Nick Fury] version[2.2.0], pid[2594], build[8ff36d1/2016-01-27T13:32:39Z][2016-04-29 16:21:12,623][INFO ][node ] [Nick Fury] initializing ...[2016-04-29 16:21:13,492][INFO ][plugins ] [Nick Fury] modules [lang-groovy, lang-expression], plugins [marvel-agent, license], sites [][2016-04-29 16:21:13,529][INFO ][env ] [Nick Fury] using [1] data paths, mounts [[/ (/dev/sda2)]], net usable_space [8.2gb], net total_space [13.6gb], spins? [possibly], types [ext4][2016-04-29 16:21:13,530][INFO ][env ] [Nick Fury] heap size [1015.6mb], compressed ordinary object pointers [true][2016-04-29 16:21:16,326][INFO ][node ] [Nick Fury] initialized[2016-04-29 16:21:16,327][INFO ][node ] [Nick Fury] starting ...[2016-04-29 16:21:16,399][INFO ][transport ] [Nick Fury] publish_address {127.0.0.1:9300}, bound_addresses {127.0.0.1:9300}[2016-04-29 16:21:16,417][INFO ][discovery ] [Nick Fury] elasticsearch/qp4x0XBQTNWeprcpiwKOHA[2016-04-29 16:21:19,502][INFO ][cluster.service ] [Nick Fury] new_master {Nick Fury}{qp4x0XBQTNWeprcpiwKOHA}{127.0.0.1}{127.0.0.1:9300}, reason: zen-disco-join(elected_as_master, [0] joins received)[2016-04-29 16:21:19,525][INFO ][http ] [Nick Fury] publish_address {127.0.0.1:9200}, bound_addresses {127.0.0.1:9200}[2016-04-29 16:21:19,528][INFO ][node ] [Nick Fury] started[2016-04-29 16:21:19,731][INFO ][gateway ] [Nick Fury] recovered [0] indices into cluster_state[2016-04-29 16:21:20,121][INFO ][license.plugin.core ] [Nick Fury] license [ad573b54-b122-45cd-b50a-6ed30b4329ab] - valid[2016-04-29 16:21:20,124][ERROR][license.plugin.core ] [Nick Fury] ## License will expire on [Sunday, May 29, 2016]. If you have a new license, please update it.# Otherwise, please reach out to your support contact.# # Commercial plugins operate with reduced functionality on license expiration:# - marvel# - The agent will stop collecting cluster and indices metrics[2016-04-29 16:21:26,952][INFO ][cluster.metadata ] [Nick Fury] [.marvel-es-2016.04.29] creating index, cause [auto(bulk api)], templates [.marvel-es], shards [1]/[1], mappings [cluster_stats, indices_stats, node_stats, index_recovery, node, shards, index_stats, _default_, nodes, cluster_state, cluster_info][2016-04-29 16:21:27,493][INFO ][cluster.metadata ] [Nick Fury] [.marvel-es-data] creating index, cause [auto(bulk api)], templates [.marvel-es], shards [1]/[1], mappings [cluster_stats, node_stats, indices_stats, index_recovery, node, shards, index_stats, nodes, _default_, cluster_state, cluster_info][2016-04-29 16:21:27,686][INFO ][cluster.routing.allocation] [Nick Fury] Cluster health status changed from [RED] to [YELLOW] (reason: [shards started [[.marvel-es-data][0], [.marvel-es-data][0]] ...]).[2016-04-29 16:21:27,925][INFO ][cluster.metadata ] [Nick Fury] [.marvel-es-2016.04.29] update_mapping [cluster_stats][2016-04-29 16:21:28,010][INFO ][cluster.metadata ] [Nick Fury] [.marvel-es-2016.04.29] update_mapping [node_stats]d[2016-04-29 16:21:38,282][INFO ][cluster.metadata ] [Nick Fury] [.marvel-es-2016.04.29] update_mapping [cluster_stats][2016-04-29 16:21:38,321][INFO ][cluster.metadata ] [Nick Fury] [.marvel-es-2016.04.29] update_mapping [indices_stats]Kibana日志 [elasticsearch@centos2 bin]$ ./kibana log [16:33:49.293] [info][status][plugin:kibana] Status changed from uninitialized to green - Ready log [16:33:49.335] [info][status][plugin:elasticsearch] Status changed from uninitialized to yellow - Waiting for Elasticsearch log [16:33:49.360] [info][status][plugin:marvel] Status changed from uninitialized to yellow - Waiting for Elasticsearch log [16:33:49.397] [info][status][plugin:kbn_vislib_vis_types] Status changed from uninitialized to green - Ready log [16:33:49.423] [info][status][plugin:markdown_vis] Status changed from uninitialized to green - Ready log [16:33:49.438] [info][status][plugin:metric_vis] Status changed from uninitialized to green - Ready log [16:33:49.469] [info][status][plugin:spyModes] Status changed from uninitialized to green - Ready log [16:33:51.297] [info][status][plugin:statusPage] Status changed from uninitialized to green - Ready log [16:33:51.317] [info][status][plugin:table_vis] Status changed from uninitialized to green - Ready log [16:33:51.341] [info][status][plugin:elasticsearch] Status changed from yellow to green - Kibana index ready log [16:33:51.380] [info][listening] Server running at http://centos2:5601 log [16:33:51.389] [info][status][plugin:marvel] Status changed from yellow to green - Marvel index ready4) 结果
你可能感兴趣的文章
php加速器 - zendopcache
查看>>
手动12 - 安装php加速器 Zend OPcache
查看>>
set theme -yii2
查看>>
yii2 - 模块(modules)的view 映射到theme里面
查看>>
yii2 - controller
查看>>
yii2 - 增加actions
查看>>
网站加载代码
查看>>
php图像处理函数大全(缩放、剪裁、缩放、翻转、旋转、透明、锐化的实例总结)
查看>>
magento url中 uenc 一坨编码 base64
查看>>
强大的jQuery焦点图无缝滚动走马灯特效插件cxScroll
查看>>
Yii2.0 数据库查询
查看>>
yii2 db 操作
查看>>
mongodb group 有条件的过滤组合个数。
查看>>
yii2 用命令行操作web下的controller
查看>>
yii2 console的使用
查看>>
关于mongodb的 数组分组 array group
查看>>
MongoDB新的数据统计框架介绍
查看>>
mongodb fulltextsearch 关于语言的设置选项
查看>>
mongodb 增加全文检索索引
查看>>
symfony
查看>>